 for the finisher to respond, but we did provide the questionnaire
as a self-mailer so it was easy and free to return the completed questionnaire.
for the finisher to respond, but we did provide the questionnaire
as a self-mailer so it was easy and free to return the completed questionnaire.
... a subject of dramatic interest to surface finishers throughout the country. Platers, painters, mechanical finishers, anodizers, etc. responded to this survey with surprisingly high interest. Better than one-quarter (26.9%) of the 1500 randomly selected finishers returned the questionnaire.
The twice-mailed survey did not include any inducements
for the finisher to respond, but we did provide the questionnaire
as a self-mailer so it was easy and free to return the completed questionnaire.
Since this is the highest level of response that we have received in several years it may be an indication that metal finishers wanted to express their opinions on automation. Or maybe it's because there were certainly different positions taken by finishers throughout the country.
Some were totally manual in operation because they define their operation as "custom." They said that their activities did not lend themselves in any way to automation. They stated that they were well pleased with how they were operating.
The same questionnaire produced finishers who were highly automated and who plan to spend more than $50,000 in the next year to further automate. They stated that they had the best way to finish the products that came into their job shops.
Polls apart in their thinking... and approaches to their finishing activities... and yet, at the same time, providing products to the end-user that were very similar if not the same.
Highlights...
|
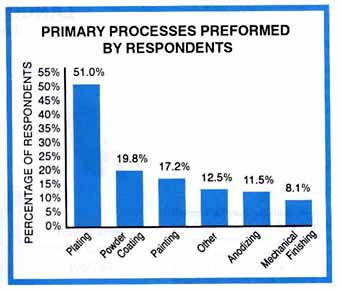
Plating is still the primary processes performed by the respondents to this survey. It is performed by 61%. However, when we compare these percentages with the past couple of surveys we find that they are all lower than they were in 1989, except for powder coating. Powder coating has grown from 13.4% to 19.8% in 1995. Plating is down from 74.7% to 61%; painting is down from 26.3% to 17.2% and anodizing has dropped from 27.4% to 11.5%.
These changes may be a result of many of the finishing shops simplifying their operations to improve efficiency ... and, possibly, profitability, ... and finding an activity that does not bring the EPA down upon them so quickly.
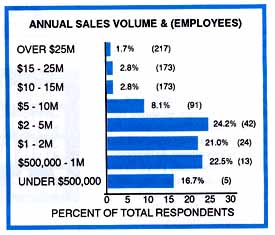
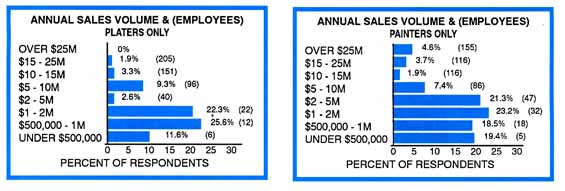
Almost 40% of this market has an annual sales volume of under $1 million. 84% have annual sales of under $5 million. And it looks like the sales volume for painters is more diverse than for platers. Painters have 4.6% of their marketplace in shops billing over $25 million in sales. No plater in the survey reported that high a sales volume. At the opposite end of the scale, 19.4% of the painters indicate that they have sales under $500,000, while only 11.6% of the platers fall into this low volume category.
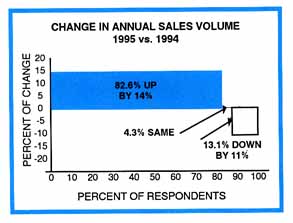
The responders estimated their annual sales volume, 1995 vs. 1994.
And they presented a similar pattern for platers, painters, and total
marketplace (including mechanical and other finishing processes).
Besides being similar in their view of 1995 (remember the survey was
 sent out mid-1995), it is a pleasant surprise to see that this year's
figures are higher by about six percentage points than last year,
and last year (1994) was about fourteen points higher than 1993. In
other words, not only are the sales volumes increasing over the past
couple of years, but the optimism of the individual job shop owner
has been climbing at an equally rapid, positive rate.
sent out mid-1995), it is a pleasant surprise to see that this year's
figures are higher by about six percentage points than last year,
and last year (1994) was about fourteen points higher than 1993. In
other words, not only are the sales volumes increasing over the past
couple of years, but the optimism of the individual job shop owner
has been climbing at an equally rapid, positive rate.
Over the past several years it would appear that as shop owners and managers have found their anticipated sales will no longer be down, they have swung over to the optimistic side to project them up. So a greater and greater percent of the respondents are projecting positive sales.
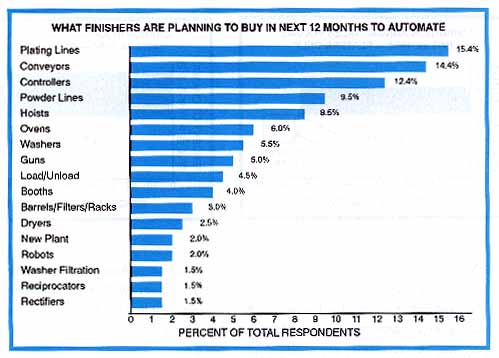
The respondents to the question about listing items that they will
be purchasing in the next twelve months to make their operation more
automatic did so without any aided recall. So that when better than
14% indicated that they were going to purchase conveyors, or better
than 12% indicate that they were going to purchase controllers, they
are still separate from the 15.4% that are saying that they will be
installing a "plating line", or the 9.5% that indicate that
they will be purchasing a "new powder line." So keep in mind
 all of the pieces of equipment that could go into the "new plant"
will be purchased by 2% of the respondents.
all of the pieces of equipment that could go into the "new plant"
will be purchased by 2% of the respondents.
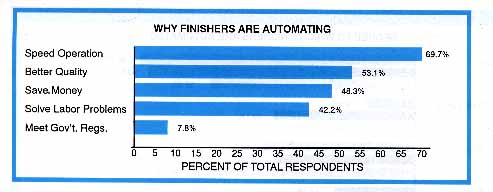
Although government regulations continue to be the bane of finishers' existence ... and continue to present problem areas that are most expensive and troublesome for finishers to correct, the survey shows that finishers are automating for much more valid reasons -- reasons such as speeding the operation, getting better quality, saving money and solving their labor problems. So in spite of the fact that experts are always talking about "being in compliance," concern about OSHA and inspections, etc. the finisher is automating for much more practical reasons.
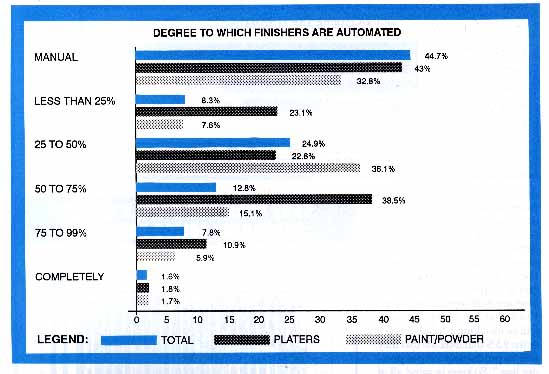
In calculating the degree to which each finisher is automated, the largest category is "manual" (no automation) and the smallest is 100% (or completely) automated. It would appear that the next highest category is 50% automated, or half-way.
In determining who is the least "automated" or manually operating in their facility, platers are well-ahead of painters in the categories of "manual" and "less than 25%" automated. However, when you also look at the categories above 50% automated, platers lead in there as well. So it would appear that platers do not do things half-way. They have a tendency to be either manual or almost completely automated. No half-way measures.
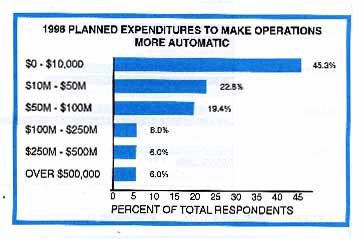
Another interesting characteristic about the degree of automation is that it has a tendency to be parallel to the degree of diversity of the finishing shop. Of the 167 respondents who indicated that they were a manual operation, they had no particular inclination to change. Fifty, or 30%, of the shops in that category gave no indication of any purchases of automated equipment in the coming year. And of those remaining in that group, 71.8% indicated they would be spending between zero and $10,000 to automate.
At the same time, well over half of the companies who consider themselves at least 75% automated will be spending more than $50,000 on new equipment for automation.
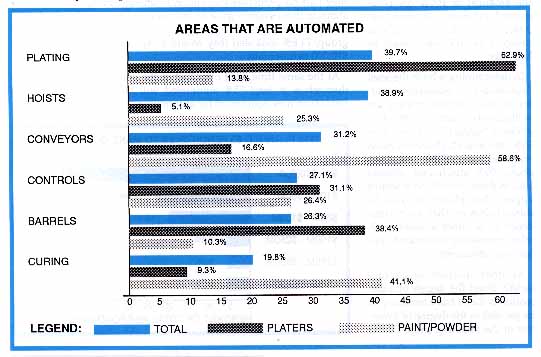
Another way of comparing the degree of automation is to look at the areas of the finishing shop that are automated. It is interesting to note that "east is east and west is west" ... or as was said elsewhere in this survey, those who are manual in operation are going to stay manual. Primarily they think of themselves in terms of doing custom work, which, of course, does not lend itself to automation.
At the same time, those who are relatively automated are still going to be spending money to become even more fully automated.
Those processes that are unique to a particular aspect of
 a finishing market, such as "curing" for paints, will, of
course, get a very low level of response for automation from platers. The
same thing is true of uniquely plating operations, such as "barrels,"
which gets a relatively low level of response on automation from painters.
a finishing market, such as "curing" for paints, will, of
course, get a very low level of response for automation from platers. The
same thing is true of uniquely plating operations, such as "barrels,"
which gets a relatively low level of response on automation from painters.
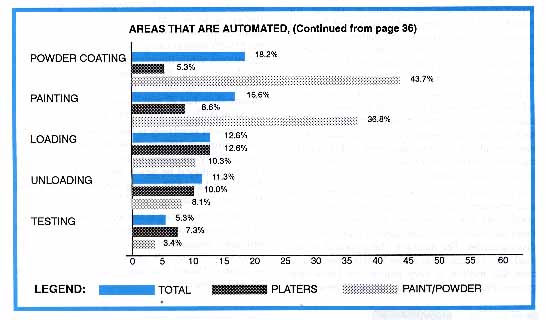
However, the product categories that are universal are viewed by painters and platers with the same degree of interest in automation. Functions such as controls, loading, unloading and testing have just about the same numbers within statistical error from the organic and inorganic segments of the finishing market.
In comparing or contrasting the painters (paint and powder
coating) with platers (plating and anodizing), the organic and inorganic
finishers, there are many more similarities than there are dissimilarities.
 For instance, the pyramid of annual sales volume from under $500,000
per year to over $25 million is very similar for these two groups.
However, the number of employees in the average job shop in these
various categories lean to the platers. In the larger operations,
there are more employees working in the average plating shop than
in the average paint/powder coating operation. It is only when we
get to the operations that are under $5 million in sales do we have
more painters in the shop than platers. For instance, in the $15-25
million category the average shop has 205 platers, while the average
paint/powder coating shop has 116. By the same token when we get
down to average sales of $1-2 million, the average plating shop has
22 employees while the average for paint is 32... an interesting
phenomenon.
For instance, the pyramid of annual sales volume from under $500,000
per year to over $25 million is very similar for these two groups.
However, the number of employees in the average job shop in these
various categories lean to the platers. In the larger operations,
there are more employees working in the average plating shop than
in the average paint/powder coating operation. It is only when we
get to the operations that are under $5 million in sales do we have
more painters in the shop than platers. For instance, in the $15-25
million category the average shop has 205 platers, while the average
paint/powder coating shop has 116. By the same token when we get
down to average sales of $1-2 million, the average plating shop has
22 employees while the average for paint is 32... an interesting
phenomenon.
An area of similarity is the projected change in sales volume in 1995 vs. 1994. 87% of the painters say that they are going to be up about 17%, with 9% saying they'd be down about 11%. Similarly, the platers have 82% saying they will be up about 11%, and 15% saying they'd be down about 11%.
Another mixed bag is the area in which the finishing operations are already automated. Areas of similarity because of commonality of need are: controls -- Platers 31% and Painters 26%; Loading -- Platers 13% and Painters 10%; testing -- platers 7% and painters 3%.
Now there are certain areas of a finishing operation that would naturally be unbalanced when you compare the degree of automation for painters versus platers. For instance, barrels -- 38% for platers and 10% for painters; conveyors -- 59% for painters and only 17% for platers; curing -- 41% for painters and 9% for platers; hoists -- 51% for platers and 25% for painters; painting -- 37% for painters and only 9% for platers. While plating had 63% for platers and 14% for painters. Again in a similar area powder coating had 44% of painters and only 5% for platers. This, of course, indicates that the more a shop does in a particular area the more likely it is to automate. This is in line with the tendency of the larger the shop operation, the more it is inclined to automate all of its areas, but emphasize specifically its key areas of production.
An area where painters and platers have a similar view of their automation is the reasons why they are doing so. 56.5% of the painters are doing it to improve quality, while 56.4% of the platers are doing so. A few more painters (57%) want to automate to save money, while only 44% of the platers wanted to save money by automation. Solving labor problems was the reason 40% of the platers and 43% of the platers wanted to automate. Speeding production was the prime reason for automating by both groups -- 69% of painters and 73% of platers. To meet government regulations was not much of a reason for the respondents to automate. Only 12% of the painters and 9% of the platers considered that an important reason.
This is one of the few areas in our industry where the government is not taking the front seat in the control of the individual job shops.