
Section 2
Overview of Project Results
2.1 DESCRIPTION OF PROJECT
2.1.1 General
The National Center for Manufacturing Sciences (NCMS) sponsored a project to assess pollution prevention and control technology available to the plating industry. Project activities included extensive surveys of the plating industry and vendors of technologies and an in-depth literature review. The plating industry survey was performed in cooperation with the National Association of Metal Finishers (NAMF). This book is the primary product of the project.
The project results are useful for all those associated with pollution prevention and control in the plating industry. The results show which treatment, recovery and bath maintenance technologies have been most successful for different plating processes and the costs for purchasing and operating these technologies. The project results also cover trends in chemical substitution, the identification of compliance-problem pollutants, sludge generation rates, off-site sludge recovery and disposal options, and many other pertinent topics. Section 2 provides an overview of the approach taken by the project team, as well as an outline of key results.
2.1.2 Relationship of Report and Database
This text and the associated database (no longer available) are a unique and dynamic method of transferring information among users of technology. The book organizes information and data from various sources, while the database gives readers a mechanism to investigate the basis of any conclusions and, if they chose, to conduct their own analyses. For example, using the database, the reader has the opportunity to further explore specific facts found in the book concerning the technologies and the plating shops that use them or to perform statistical analyses on categories of data that may answer the reader's own unique technical, regulatory or economic questions. The book and database are dynamic in the sense that an updated version of each will be prepared once these results are disseminated and feedback is received. This will include additional data that will be accepted from new respondents to the Users Survey and Vendors Survey (see definitions of the surveys in Section 2.1.3).
2.1.3 Project Scope
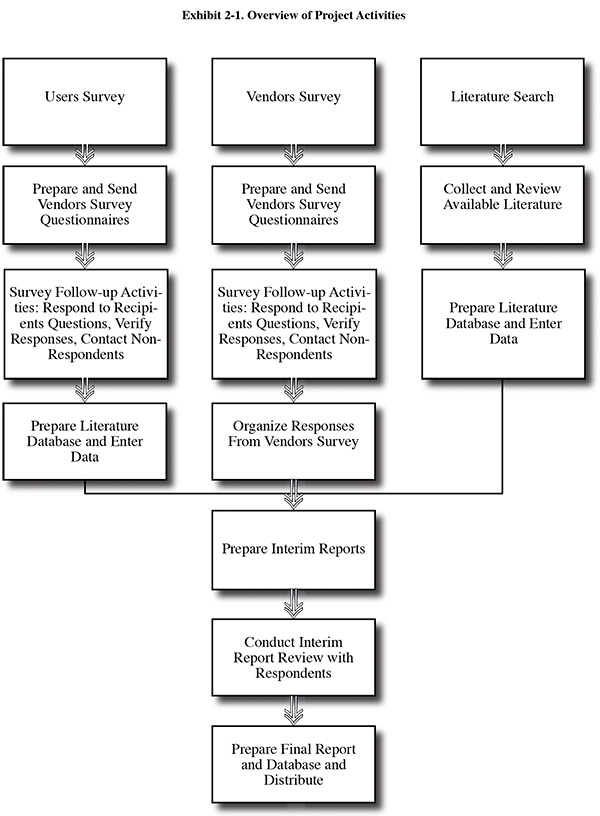
A diagram showing the various stages of the project is provided in Exhibit 2-1. The assessment was conducted using three major sources of information and data:
- A mailed questionnaire-survey sent to approximately 2,000 electroplating and metal finishing plants (Users Survey).
- A mailed questionnaire-survey of approximately 60 vendors of pollution prevention and control equipment and off-site metals recycling services (Vendors Survey).
- A literature search that gathered approximately 520 articles, reports, conference papers and other sources of relevant information.
Using the collected materials, information and data, a set of seven Interim Reports was written covering the following topics:
- Interim Report No. 1: Overview of Project Results
- Interim Report No. 2: General Waste Reduction Practices
- Interim Report No. 3: Chemical Recovery
- Interim Report No. 4: Chemical Solution Maintenance
- Interim Report No. 5: Process Substitution
- Interim Report No. 6: Wastewater Treatment
- Interim Report No. 7: Off-Site Metals Recycling
The Interim Reports were distributed to the respondents of the Users and Vendors Surveys and other interested parties. Based on comments received during the review process, the Interim Reports were revised and subsequently consolidated into this text. The text and associated database will be updated once these results are disseminated and feedback is received. This will include additional data that will be accepted from new respondents to the Users Survey and Vendors Survey.
The most important element of the project was the Users Survey. During this project phase, a questionnaire was developed and sent to approximately 2,000 electroplating and metal finishing plants. The questionnaire development process included the preparation of several drafts of the survey form that were tested on representative plating shops. Also, during the development of the questionnaire, input was received from the National Association of Metal Finishers (NAMF), American Electroplaters and Surface Finishers (AESF), other industry personnel and the U.S. Environmental Protection Agency (EPA).
The Users Survey questionnaire covered seven major areas:
- Facility Identification and Characterization Data (company name, point of contact, number of employees, age of plant, general types of plating equipment used, primary business areas, and production rates).
- Wastewater Data (type of discharge: direct, indirect, zero; plating and other industrial wastewater flow rates; effluent limitations; and compliance difficulties).
- Process Identification (metal cleaning including solvent use, plating, stripping, aluminum finishing, other surface finishing processes, number of process tanks of each type and total volumes of specific process solutions).
- Pollution Prevention and Recycle Technology Identification (frequency of use and level of success for: good operating practices, rinse water and drag-out reduction, chemical recovery technologies, bath maintenance technologies, product changes, bath chemistry changes, and off-site recycling).
- Technology Data Sheets (details for advanced chemical recovery/recycling and bath maintenance technologies including: manufacturer, date of purchase, capital and operating costs/savings, skill requirements and man-hour requirements for operation and maintenance, satisfaction ratings for vendors and the technology itself, performance and operational and maintenance details, residuals generation, and future plans of the technology user).
- End-of-Pipe Treatment (details of processes employed, ratings of manufacturers, chemical reagent requirements and costs, labor requirements, residuals generation, and associated compliance problems).
- Identification of Facility Problems and Needs (environmental problems, technical information needs, technical resources that are utilized, ideas on dissemination and use of the project results).
The mailing list for the Users Survey included all members of the National Association of Metal Finishers, participating member companies of the National Center for Manufacturing Sciences that operate plating shops, military plating shops and captive plating shops that were identified by Elsevier Science Publishing Co. (Metal Finishing magazine).
To store, organize and utilize the data from the Users Survey, a database was prepared.1 Because the database would be made publicly available, respondents were assigned a code number which was entered into the database in place of a company's or individual's name. Database control software was developed using a commercial program (Clarion™). The database was then utilized to provide statistical results from the Users Survey.
The commercial software that was selected is a modern, professional, relational database language that allows the production of a free-standing program to control and use the database without any royalty, user fee, or distribution requirement or cost. This is unlike many other languages that are subject to distribution fees or requirements to buy "runtime" software to operate the programs. Furthermore, the resulting program is user-friendly and menu-driven and can be used without any knowledge of database language or specific expertise in software. The hardware requirements include an IBM AT, PS/2 or 100% compatible computer, IBM DOS 3.1 or higher operating system, 640 KB ram, EGA or VAG color monitor, one 5-1/4" or 3-1/2" diskette drive, a hard drive and a parallel laser printer with full IBM-US character set.
Although for most users the original version of the database is expected to be sufficient, other users may want a different format that is more familiar to them. As such, converted formats (e.g., dbase™) are available.
The database (no longer available), which like this report is publicly available, contains most of the data entered into the Users Survey questionnaires (most comments or experiences that did not fit into the database format have been included in this text). Although much of the Users Survey data has already been evaluated and summarized in this text, individuals or organizations may want to use the database to find out specific details concerning a given technology application or to prepare their own statistical analyses or summaries. Therefore, the availability of the database enhances the usefulness of the text. As an example, Section 7 covers technologies used for end-of-pipe treatment. A reader of the text may locate from data tables a shop using a specific combination of technologies that the reader is investigating. Using the database, the reader can quickly determine what plating processes that shop has in place and the volumes of solutions that are present, the effluent limitations that the shop is required to meet, any compliance problems they have reported, what methods of recovery/recycle or bath maintenance are also used that may impact the end-of-pipe process selection or other specific facts that may have influenced the choice of treatment technologies.
2.1.4 Project Organization and Participants
This project was sponsored by the National Center for Manufacturing Sciences. Partial funding for the project was provided by the Joyce Foundation. The project was managed by Paul D. Chalmer, Ph.D. of NCMS. Highly valued technical support and guidance during the project were provided by the following individuals (company and/or affiliation shown in parenthesis):
- Frank Altmayer (Scientific Control Laboratory and the American Electroplaters and Surface Finishers Society)
- Brenda Harrison (Texas Instruments)
- Dave Marsh (Marsh Plating and the National Association of Metal Finishers)
- Brian Manty (United Technologies, Pratt & Whit-ney)
- Brian Ramey (the former General Motors, Allison Gas Turbine Division)
- Bill Sonntag (National Association of Metal Finishers)
The key project participants in this study were the plating shop personnel that completed survey forms and provided other technical information. The members of the National Association of Metal Finishers provided approximately 1,800 man-hours of time collecting data and completing the forms. The time spent by other individuals from plating shops totaled approximately 200 man-hours.
Another key source of information and data for this project was provided by the manufacturers and vendors of pollution prevention and control equipment and operators of off-site metals recovery operations. These companies are identified in Section 2.1.6. Individuals from these companies that contributed most significantly are: Fred Reinhard (Kinetic Recovery Corporation); Serge Astaud (i3); Lyle Kirman (Kinetico Engineered Systems, Inc.); Larry Zitko, (Chrometech, Inc.); Stratton Tragellis (Memtek Corporation); and Jon Youngson (Midwest Air Products, Co.).
The contractor for this project was CAI Resources. George Cushnie was the CAI project manager and the author of the surveys and this text. The Users Survey database development was performed by a consultant, George Ryder. Mark Eelman of CAI Resources provided extensive technical and economic input regarding chemical recovery and bath maintenance technologies. Peter Gallerani of Integrated Technologies developed cost curves from vendor data. George Pollin and Leslie Cushnie of CAI provided technical input and assisted in conducting the surveys and organizing the literature database. Leslie Cushnie also managed the publication of this text. Nova Ryder performed data input for the Users Survey. Kim Tomlinson prepared graphics and performed word processing. Tom Higgins and Jeff Enzminger of CH2M Hill provided a portion of the technical literature used during the project.
2.1.5 Description of the Users Survey
A portion of the Users Survey results are presented in Section 2.2 and in various other sections of the text. Some key details of the Users Survey are presented here, so that readers may understand the methodology employed to gather and organize the data.
The survey form employed during the Users Survey was developed through an iterative process. Draft versions of the form were prepared by the contractor and reviewed by the National Center for Manufacturing Sciences Project Manager and Steering Group, the AESF, other industry members and EPA. Two draft versions of the form were sent to a portion of the NAMF membership to be completed and critiqued. The iterative survey development process employed these various sources to improve the survey form in four ways:
- improved the clarity of questions
- improved the format of the forms
- minimized technical and typographical errors
- expanded the technical coverage of the form to better meet the objectives of the project.
These improvements resulted in clearer and more in-depth responses from platers, an increase in the technical and regulatory scope of the questionnaire, and an improvement in the amenability of the data to inclusion in a database. The iterative process also permitted the contractor to improve the efficiency of mailing, non-response follow-up, and response handling techniques. The inclusion of EPA and AESF in the survey form review process expanded the technical base from which the survey was developed.
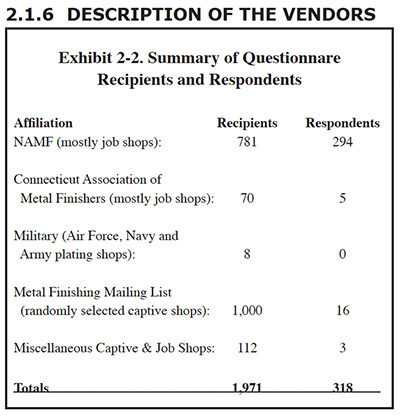
The Users Survey was sent to approximately 2,000 companies and government facilities that perform electroplating. A significant portion of these shops and the majority of the respondents were members of the National Association of Metal Finishers. Most of these NAMF shops are job or contract shops. This type of plating business processes parts for manufacturers of products, and is differentiated from a captive shop, which is an internal plating operation at a manufacturing plant. Other recipients included: members of the Connecticut Association of Metal Finishers (mostly job shops); NCMS members (mostly captive shops of Steering Group companies); captive shops randomly selected from the mailing list of the Metal Finishing magazine; and military plating shops. The number of plating shops included in the survey and the number of respondents from each group are shown in Exhibit 2-2.
SURVEY
The Vendors Survey was conducted to supplement the data from the Users Survey. Whereas the focus of the Users Survey was on determining the performance and operating costs for technologies, the focus of the Vendors Survey was on identifying the types, capital costs and design features of commercially available equipment. Also, companies offering off-site metals recycling services were surveyed. Twelve specific questionnaires were prepared to solicit information on the following topics:
- Ion Exchange
- Electrowinning
- Electrodialysis
- Diffusion Dialysis
- Membrane Electrolysis
- Atmospheric Evaporators
- Vacuum Evaporators
- Reverse Osmosis
- Ultrafiltration/Microfiltration
- Acid Sorption (acid retardation)
- End-of-Pipe Treatment
- Off-Site Metals Recycling
Each of the technology survey forms requested respondents to provide a specific list of applications for their equipment (e.g., recovery of nickel from rinse water), the number of units sold for each application, available equipment sizes or capacities, materials of construction, optional equipment, expected equipment life-span and equipment prices.
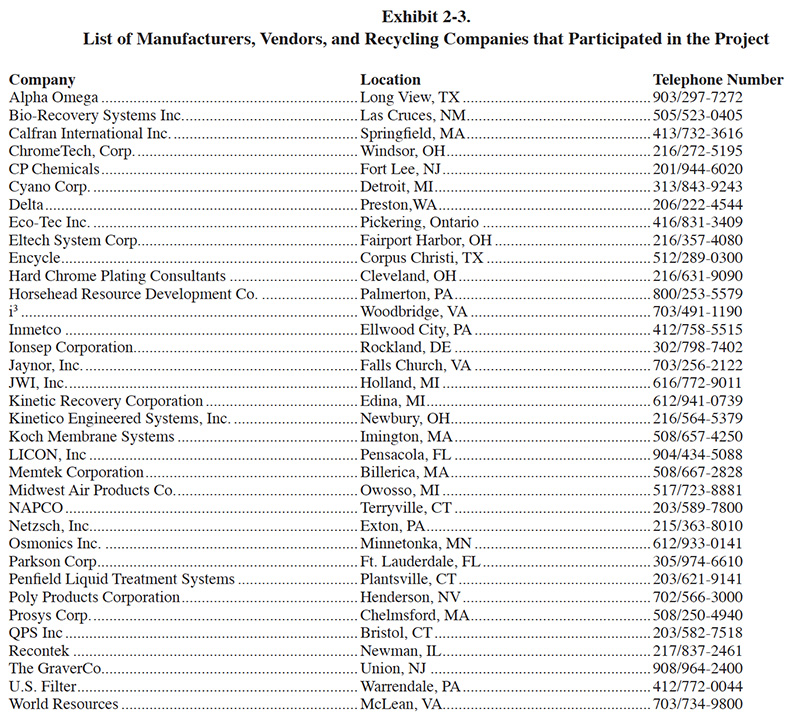
Thirty-five manufacturers/vendors of these pollution prevention and control technologies and services completed survey forms or provided equivalent information. These companies are listed in Exhibit 2-3.
2.1.7 Description of the Literature Search
The literature search gathered information from a wide range of sources including: journals, books, conference proceedings, reports, and technical brochures. The results were cataloged using a database and organized by subject (e.g., waste reduction, end-of-pipe treatment, regulations), technology (e.g., reverse osmosis, filtration), and applications (e.g., chromium plating, aluminum finishing, printed circuit board manufacturing). More than 500 literature sources were identified, reviewed, and entered into the database for use on the project and they are listed in the reference section of this text.
2.2 OVERVIEW OF USERS SURVEY RESULTS
This section presents an overview of the Users Survey data. More in-depth summaries and discussions of the data are presented in the other sections.
2.2.1 Characterization of Respondents
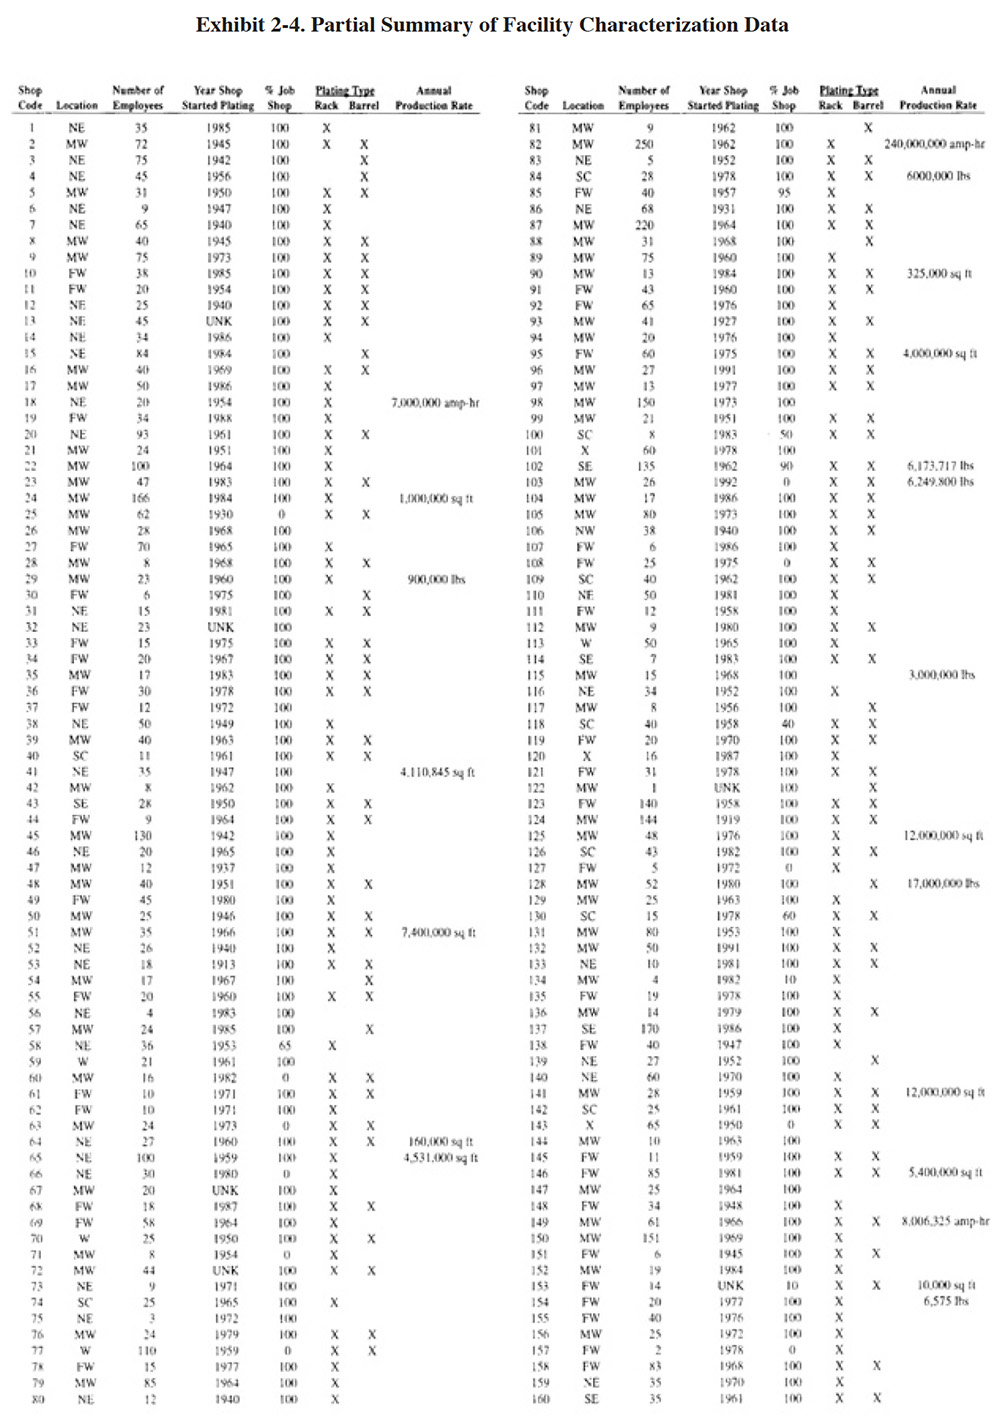
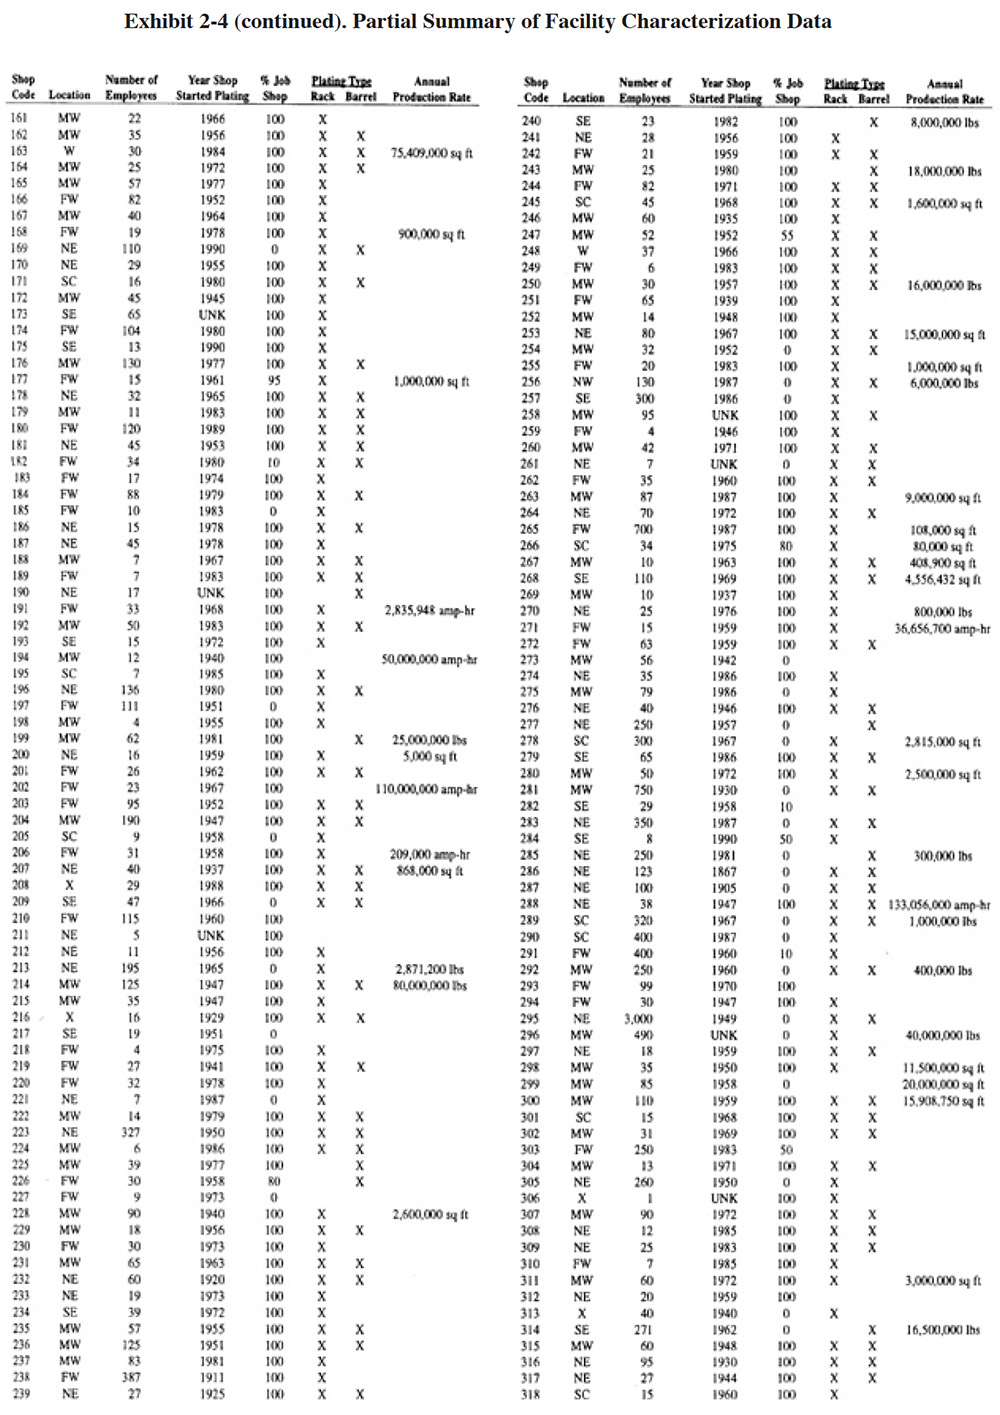
Exhibit 2-4 provides some basic facility characterization data for the survey respondents. The identity code of each shop is shown in column 1. These codes are used throughout the text where they are expressed as PS 001 through PS 318 (PS stands for plating shop and is used in the text to differentiate the Users Survey data from the literature references, which are simply numbered 1 through 522). The location of the shop is shown in column 2 and is expressed as a region of the U.S. The regional codes are as follows:
- NE - Northeast
- SE - Southeast
- MW - Midwest
- SC - South Central
- W - West
- FW - Far West
- NW - Northwest
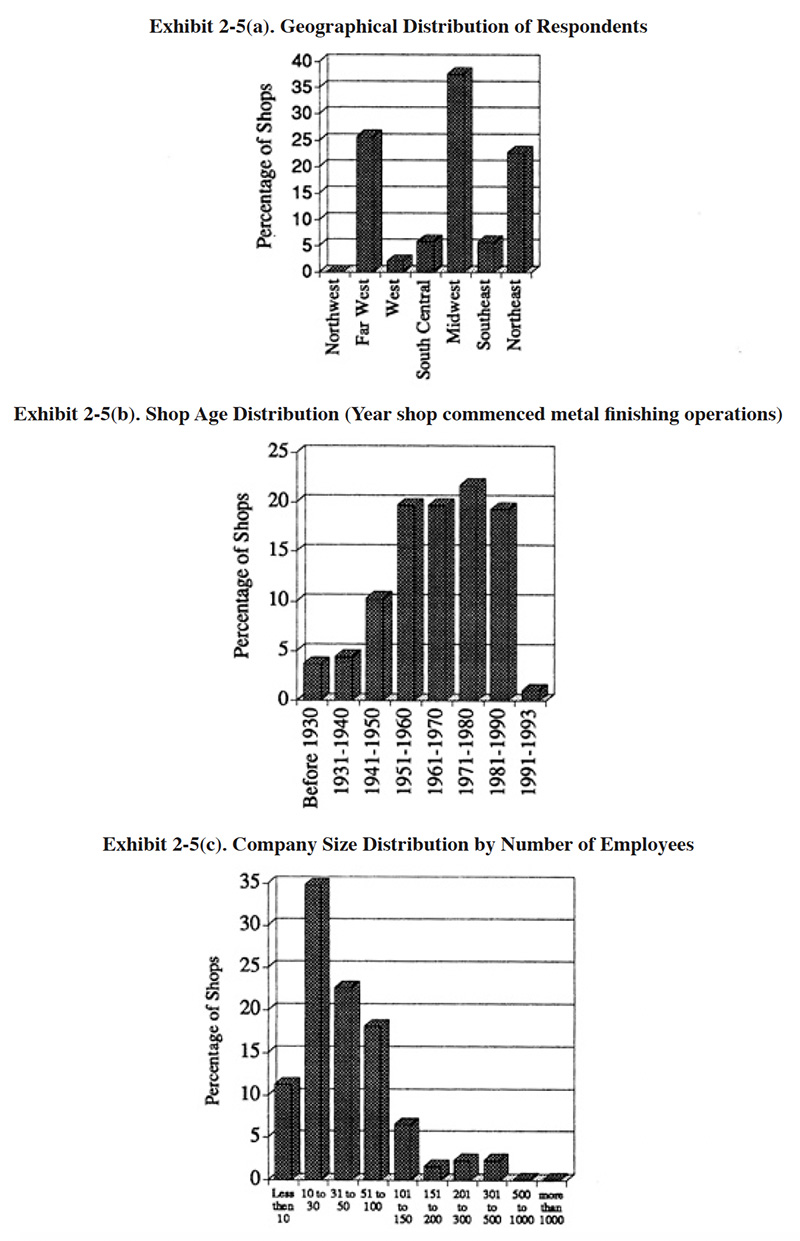
Although each of these regions has been specifically defined in terms of which states they contain, that information is not presented in the database or within this text in order to further preserve the confidentiality of the responses. Several respondents sent in anonymous survey forms and their location was unknown. The region for these shops is designated as "X". The total number of employees for each shop is shown in column 3. Additional data on employees are contained in the database, including the number of equivalent full-time employees working in the plating shop and a breakdown by labor category (platers, rackers, skilled trades, process engineers, chemists, environmental engineers, and other). Column 4 shows the year that the shop commenced metal finishing operations at the location for which the survey form was completed. Column 5 indicates the percentage of the plating work that is contract work (job shop). Where the percentage is less than 100%, the remaining percentage is captive shop work. The next two columns indicate the type of plating equipment that is present; either rack or barrel. The database contains additional plating equipment data concerning the level of automation present (e.g., automatic with manual loading vs fully automatic). The last column presents annual production data in terms of square feet of plating, pounds of parts processed or amp-hours of rectifier usage. Since most job shops are unable to track their work volume using these units or other non-fiscal units, this column contains many blanks. Exhibits 2-5 (a) (b) and (c) graphically display some of the facility characterization data.
2.2.2 Metal Finishing Process Characterization
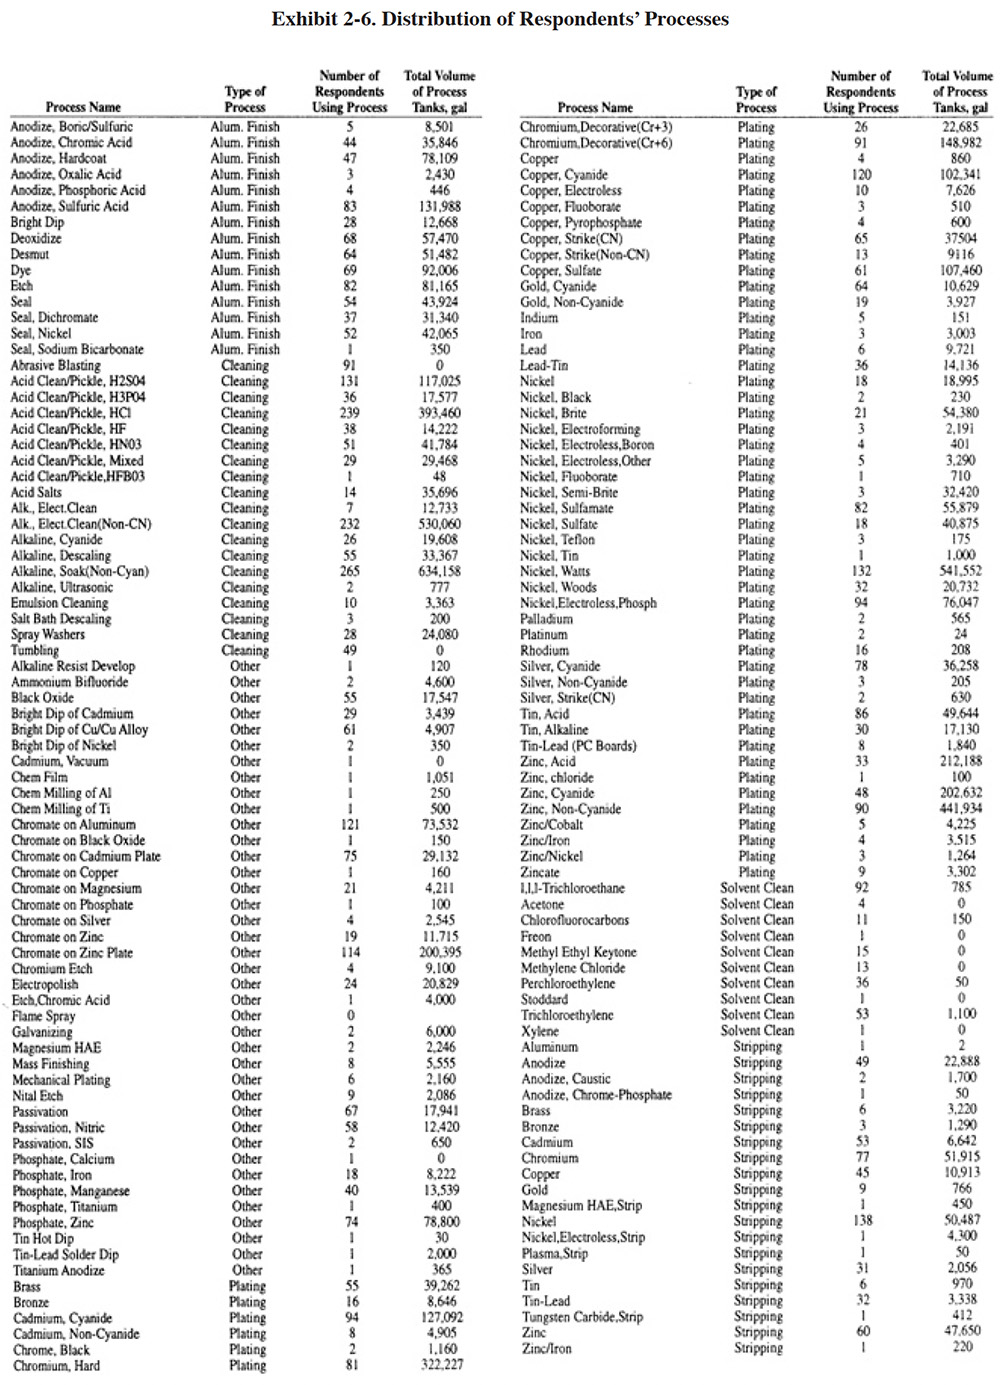
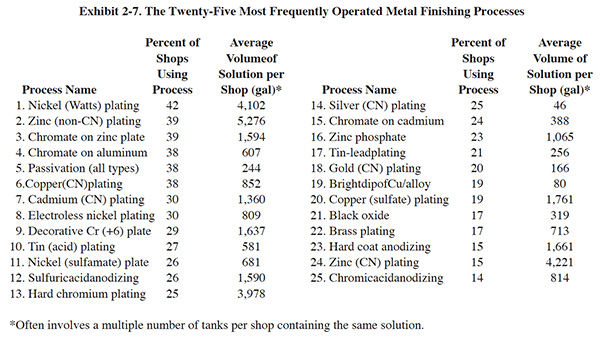
Exhibit 2-6 presents a portion of the process data. Column 1 shows the process name. Column 2 indicates the type of the process, either aluminum finishing, cleaning, other (e.g., conversion coating and passivation), plating, solvent cleaning, or stripping. The third column indicates the number of respondents that employ each process and the last column indicates the total volume of their process tanks. Collectively, the respondents to the Users Survey operate 167 different types of metal finishing processes. The 25 most frequently found processes are identified in Exhibit 2-7 (excludes pre-plating, post-plating and stripping processes).
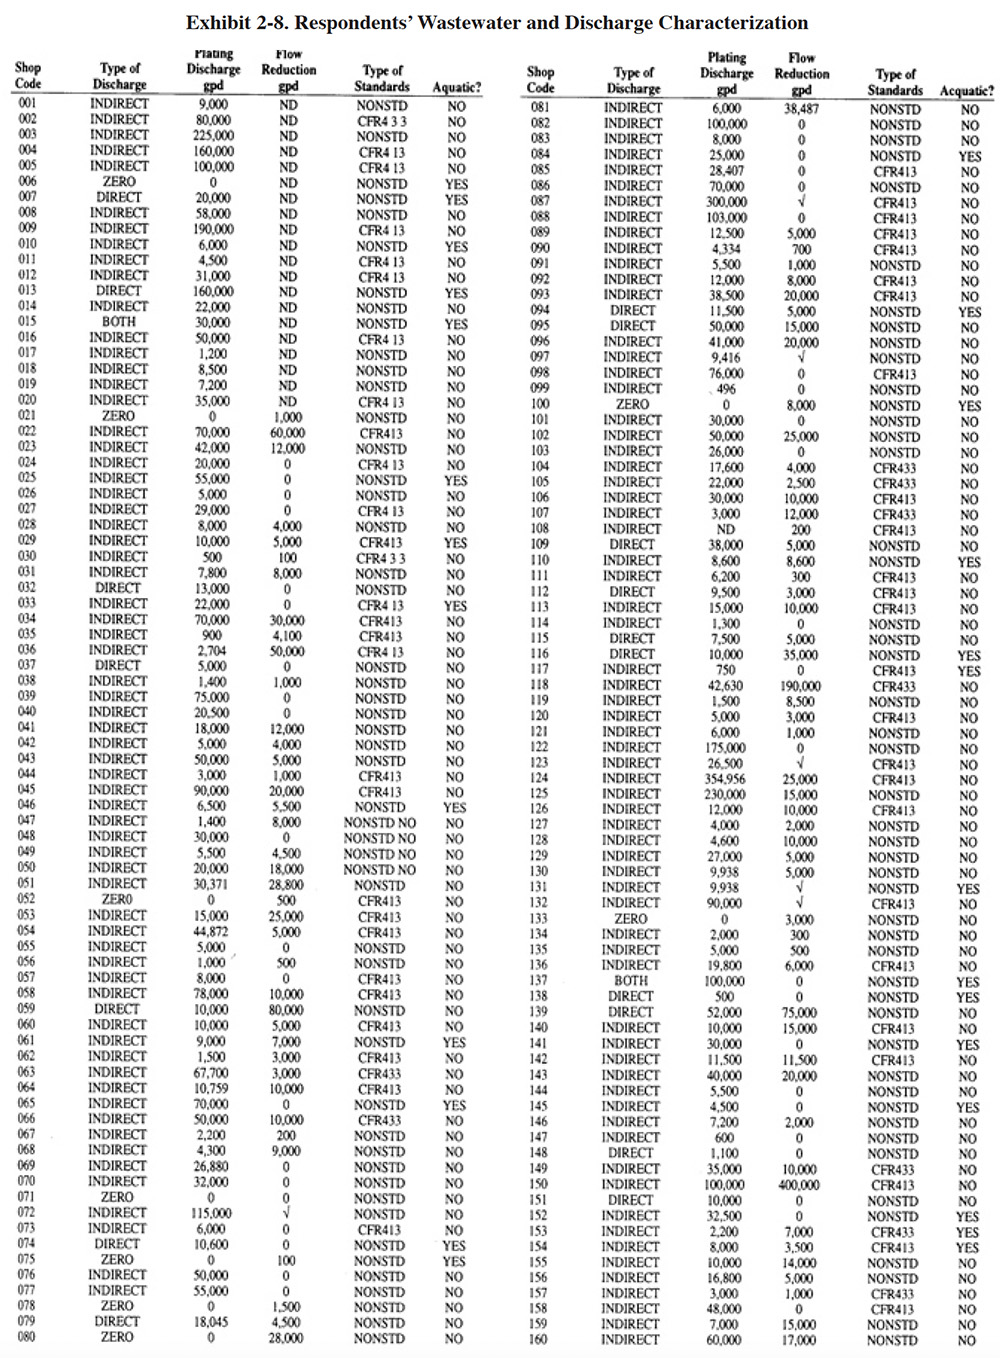
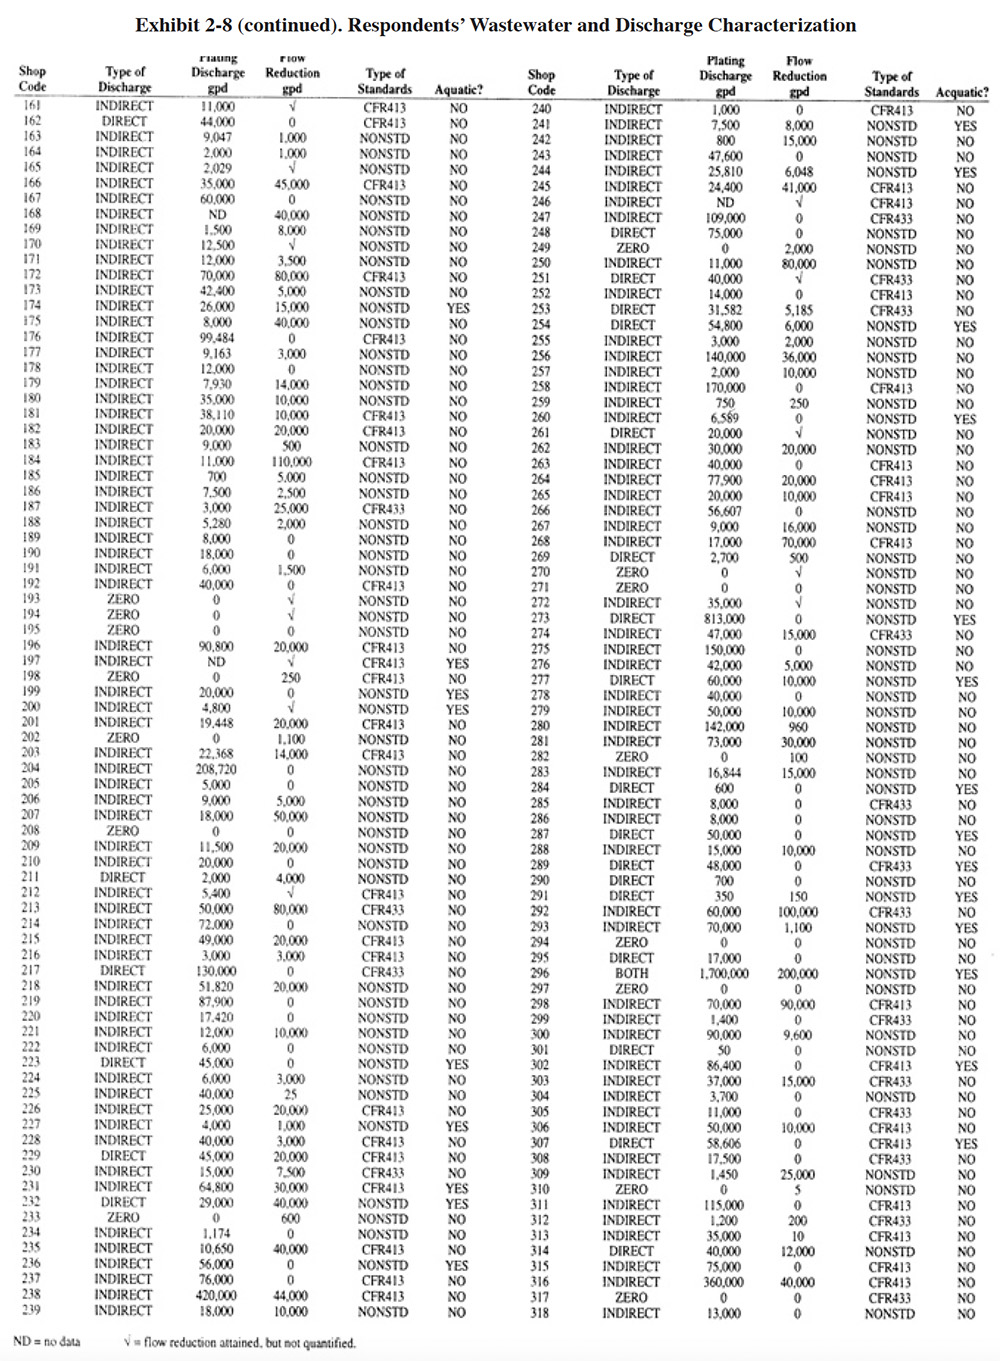
2.2.3 Wastewater and Discharge Characterization
Exhibit 2-8 provides an overview of the wastewater data contained in the Users Survey database. Column 1 shows the shop code. Column 2 indicates the type of wastewater discharge (direct—to a stream or river, indirect—to a publicly owned treatment works or POTW, or zero discharge—no wastewater discharge). Column 3 indicates the average discharge rate from the plating operations. The database also contains data for the maximum plating discharge and the average and maximum total industrial discharge. Column 4 indicates the amount of flow reduction that has been achieved through the implementation of pollution prevention techniques and methods. The next two columns indicate the type of effluent regulations that apply to each shop. These are shown as either standard or non-standard (i.e., CFR 413 or CFR 433) and aquatic-toxicity-based.
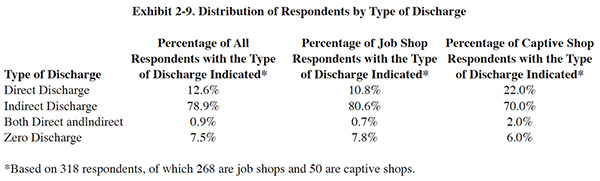
The majority of the respondents to the Users Survey are indirect dischargers. The percentage of shops that are either indirect, direct, both indirect and direct, and zero discharge are shown in Exhibit 2-9. These data indicate that captive shops are more likely to be direct dischargers than are job shops. EPA estimates in 1984 indicated a similar trend (ref. 517).
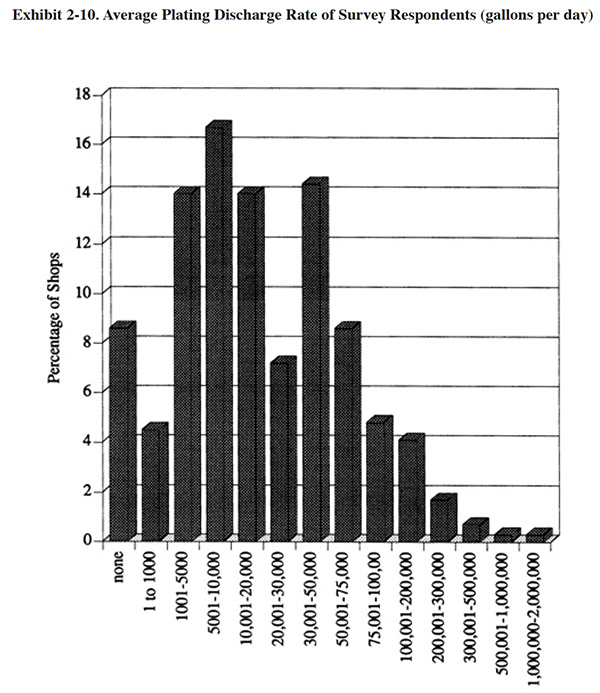
The electroplating discharge rates (average daily flows) of the survey respondents vary from 0 gpd to 420,000 gpd (some higher discharge rates were reported for combined plating and non-plating industrial discharges). The average and median plating discharge rates for respondents were 34,600 gpd and 14,000 gpd, respectively (see Exhibit 2-10 for a graphical summary of discharge data). Many shops indicated that they have made drastic progress in reducing wastewater flow rates, the most significant of which are listed in Section 3.
The respondents to the Users Survey are required to meet either CFR 413 (Electroplating Categorical Standards), CFR 433 (Metal Finishing Categorical Standards), or non-standard effluent limitations. Non-standard limitations are more stringent than the categorical standards for one or more pollutant parameters. Some of the non-standard limitations are written in terms of pollutant mass and flow rates (e.g., 0.37 lbs/day of chromium with a maximum flow of 40,000 gpd) rather than concentration limitations. The percentage of respondents that are required to meet each type of effluent limitation are as follows:
40 CFR 413: 28%
40 CFR 433: 8%
Non-Standard: 64%
In addition to concentration or pollutant mass discharge standards, 16% of the respondents indicated that they are also subject to aquatic-toxicity-based effluent standards. These limits require that an industrial wastewater be sufficiently treated such that certain percentages of organisms (typically fish and water fleas) are able to survive in the effluent for a given time period.
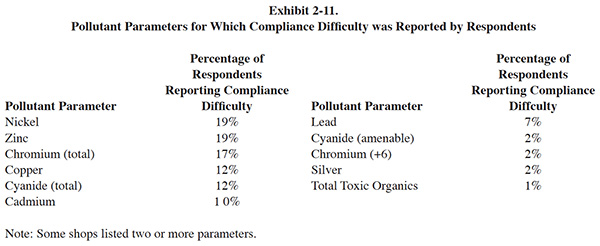
More detailed data on regulations and the compliance experience for each shop are contained in the database. For example, the Users Survey asked platers to list the pollutant parameters for which they have compliance difficulty. A summary of their responses is shown in Exhibit 2-11.
2.2.4 Pollution Prevention
Various terms are used to group or categorize the different methods employed by industry in their pollution control strategies, e.g., pollution prevention, source control, waste minimization, and in-plant changes. One popular term used extensively by EPA since 1988 is pollution prevention. This term is defined by EPA as the maximum feasible reduction of all wastes (wastewater, solid waste and air emissions) generated at production sites. It involves the judicious use of resources through source reduction, energy efficiency, reuse of input materials during production and reduced water consumption. Pollution prevention covers a broad range of pollution control methods employed by plating shops, such as drag-out and rinse water reduction, chemical recovery from rinse waters, bath maintenance, and material substitution. Each of these aspects of pollution prevention have been addressed by the Users Survey. An overview of the survey results are presented here and details are contained in Sections 3, 4, 5 and 6.
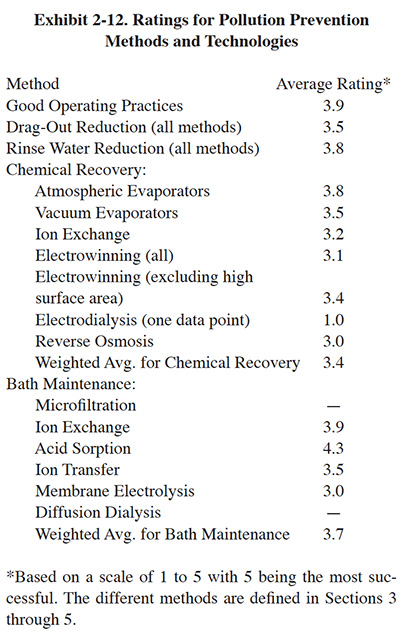
For platers, pollution prevention has emerged as an important set of tools used to help attain compliance and reduce operating costs. Widespread success has been achieved using simple methods and techniques that reduce drag-out losses and rinse water use. More than 90 percent of the shops indicated that they utilize these tools and have benefited from them. Although some shops have had great success with chemical recovery technologies, these have generally been much less frequently applied than drag-out and rinse water reduction efforts. The most successful of the chemical recovery technologies is atmospheric evaporation, which is also generally regarded as the least technically sophisticated recovery technology. Bath maintenance technologies are less frequently purchased than are chemical recovery technologies, but have generally been more successful. Exhibit 2-12 shows ratings given by the respondents for some common pollution prevention methods. The following subsections provide overviews of key pollution prevention topics.
2.2.4.1 Drag-Out and Rinse Water Reduction
For the typical electroplating job shop, the drag-out of process solutions and the subsequent contamination of rinse waters are the major pollution control problems. Section 3 contains an explanation of the basic principles of drag-out theory and explores the function and applicability of the various drag-out minimization techniques in use today. Because of the importance of drag-out and drag-out loss prevention, numerous questions in the Users Survey were related to this topic. The responses to these questions are statistically evaluated in Section 3 and summarized in this subsection.
The Users Survey asked respondents to indicate and rate the usefulness of the methods that they employ to reduce the formation or loss of drag-out and the usage rate of rinse water. A summary of their responses is presented in Sections 3.4 and 3.5. The most frequently used drag-out reduction methods are: allowing parts/racks to drip over process tanks; the use of drag-out rinses; reducing the speed of rack/part withdrawal; use of drip shields; and positioning the workpiece to minimize solution holdup. On the average, all of the drag-out reduction methods that are used by the respondents have been successfully applied. Some shops had specific problems with one or more methods (e.g., buildup of bath contaminants). These problems are discussed in Section 3 along with potential solutions.
The most frequently used methods of reducing water use involve the application of: flow restrictors; counterflow rinses; manually turning off water; and air agitation. As with drag-out methods, the rinse water reduction methods have been generally successful, with the highest success ratings given to the use of flow restrictors and counter-flow rinsing.
2.2.4.2 Chemical Recovery Technologies
Chemical recovery technologies are used by platers to separate plating chemicals from rinse waters or other solutions or to concentrate them, thereby making them available for reuse/recycle. According the respondents of the Users Survey, chemical recovery technologies are most frequently purchased to (in order of frequency): help meet effluent regulations; reduce wastewater treatment costs; reduce plating chemical purchases; and reduce the quantity of waste shipped off-site.
The Users Survey requested platers to provide detailed technical, performance and operating cost data for chemical recovery technologies. Also, during their survey, vendors were requested to provide technology descriptions, operating data and capital cost data. As a result of obtaining data from these two sources, plus the information from the extensive literature review, this text contains a substantial quantity of information for the following chemical recovery technologies: electrodialysis, electrowinning, atmospheric evaporators, vacuum evaporators, ion exchange, reverse osmosis and meshpad mist eliminators. A separate subsection of the report is devoted to each of these technologies. Within each subsection, the following are provided: technology overview; development and commercialization; applications and restrictions (with diagrams showing different potential configurations); technology/equipment description; capital costs; operating costs; performance experience; and residuals generation.
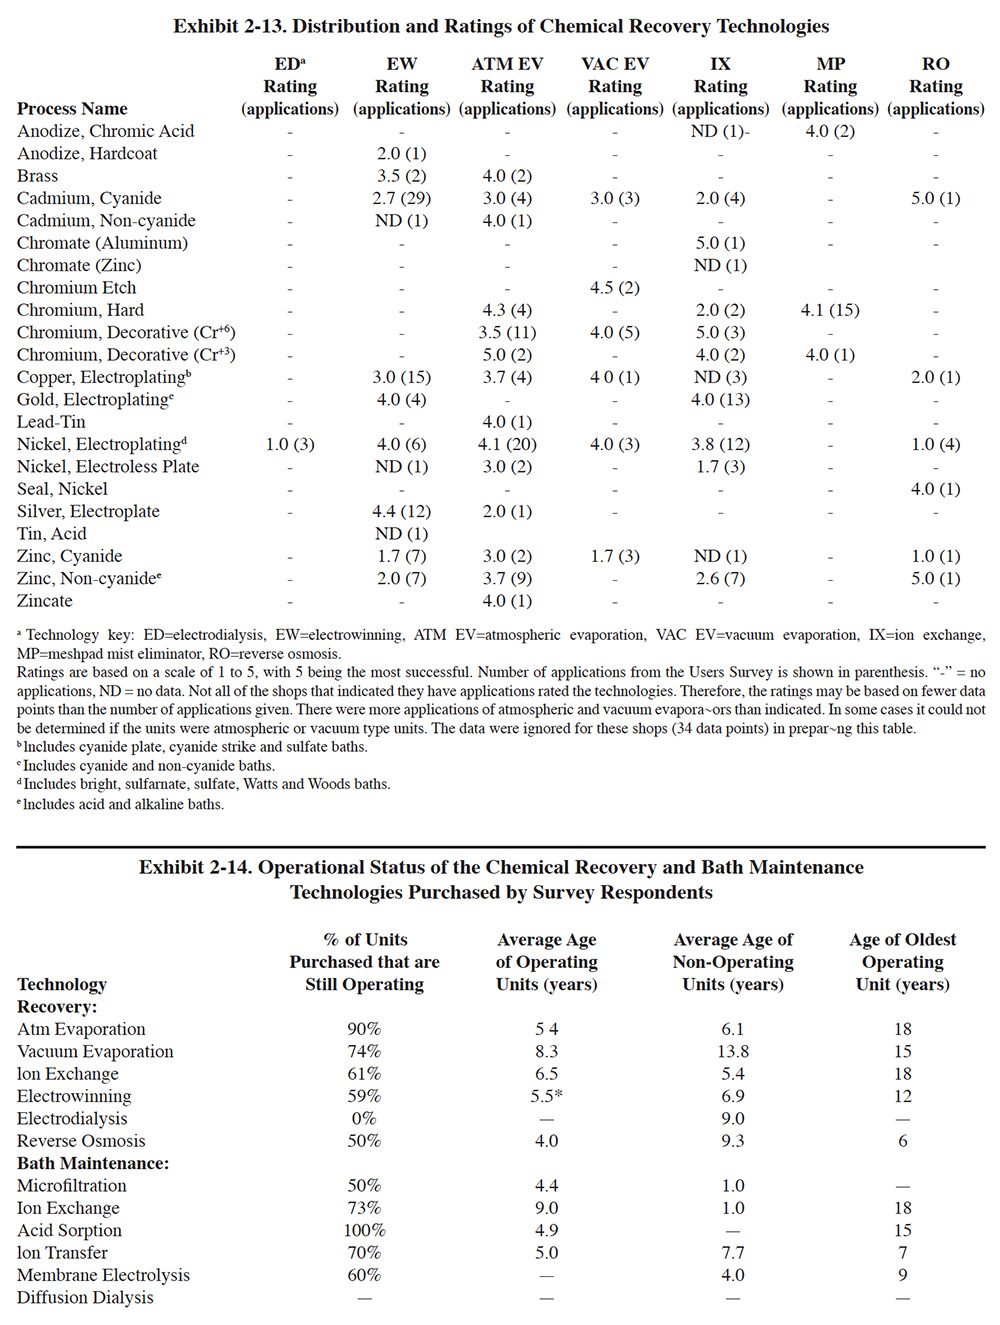
Exhibit 2-13 presents a summary of the chemical recovery applications addressed by the Users Survey data.
Many installations of chemical recovery technologies and advanced bath maintenance (see Section 2.2.4.3) have not been successful (approximately 30 to 40 percent). The survey respondents indicate that failure is most frequently caused by: maintenance problems, misapplication of the technology (often due to ignorance on the part of manufacturers' representatives and/or the plating shop personnel), poor design, inability to purchase replacement parts (usually manufacturer went out of business), poor technical support by manufacturers, improper operation of technology by shop personnel, technically too complex for employees, chemical recovery caused a build-up of contaminants in plating bath, recovery process destroyed plating chemicals, recycled water was of insufficient quality, chemical product was insufficiently concentrated for return to plating bath, inadequate capacity, and high residuals generation.
Maintenance problems were the most frequent cause of system failure. The maintenance problems most often reported with advanced technologies are: low quality system components, mechanical problems with pumps and valves, damage to or fouling of components by plating chemicals, and excessive labor requirements for system cleaning.
Exhibit 2-14 indicates the operational status of the chemical recovery and bath maintenance technologies purchased by survey respondents.
2.2.4.3 Solution Maintenance Methods and Technologies
Metal finishing solutions are subjected to a variety of forces that cause them to become unusable. The key contributing factors are: (1) depletion of bath chemicals; (2) chemical break-down of process chemicals or chemical side reactions; (3) contamination from impurities in make-up water, chemicals or anodes; (4) anodic/cathodic etching of parts and inert electrodes; (5) corrosion of parts, racks, bussing, tanks, heating coils, etc.; (6) drag-in of non-compatible chemicals; (7) buildup of by-products (e.g., carbonates); (8) breakdown of maskant, fume suppressant and wetting agents; (9) errors in bath additions; and (10) airborne particles entering the tank.
Solution maintenance replaces the practices of: (1) using a fresh chemical solution until it is degraded and replacing it with fresh solution or (2) decanting a portion of a degraded solution and replacing it with fresh solution. In both cases, the spent solution is usually either treated on-site or transported to a treatment/disposal site. On-site treatment is not always possible because concentrated wastes may upset treatment facilities designed primarily for treating dilute rinse waters.
Two major categories of solution maintenance were identified during the project: preventative and corrective. Within this text, preventative solution maintenance refers to the practices that avoid bath contamination or involve monitoring and adjusting of solution chemistry. Corrective solution maintenance refers to the practice of removing contaminants from the bath, whether they are dissolved or particulate, organic or inorganic. Both preventative and corrective solution maintenance involve the use of methods, techniques and technologies. Methods and techniques are typically procedural in nature or low capital items that can be implemented quickly and have an almost immediate payback. Technologies are generally equipment packages that have a moderate to high capital cost and payback periods of one year or greater. Most preventative measures are either methods or techniques. Corrective measures include both methods/techniques such as dummy plating and technologies such as microfiltration.
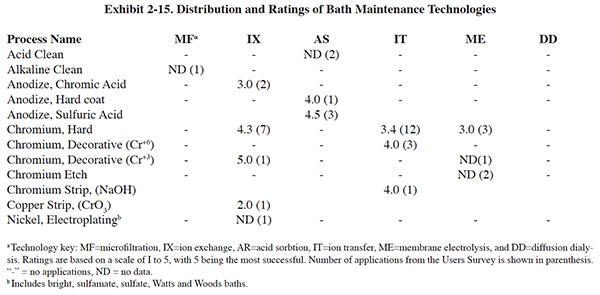
Within this text, the corrective technologies, which are generally less familiar to platers, are covered in detail. The methods of preventative and corrective solution maintenance that are commonly applied by plating shops (e.g., filtration) are more familiar to platers and therefore are covered less extensively. The bath maintenance technologies addressed by the project include: microfiltration, ion exchange, acid sorption, ion transfer, membrane electrolysis and diffusion dialysis. Exhibit 2-15 presents a summary of the corrective technology use by respondents to the Users Survey.
2.2.4.4 Substitute Technologies
The results of the Users Survey show that respondents have made significant strides in reducing or eliminating the use of chlorinated solvents, cadmium, cyanide and chromium. Sometimes referred to as the four Cs, these materials have been identified by EPA as key targets for control within the metal finishing industry. Approximately 60 percent of the respondents attempted material input changes that potentially reduce or eliminate the use of one or more of the four Cs or another pollutant problem. Based on the comments received from respondents, these changes were made in an effort to reduce the impacts of their processes on the environment and worker health, to help meet environmental regulations and to reduce operating costs.
Although most of the material input changes attempted by survey respondents have been successful, there have been some failures and in many cases, even with successful changes, there have been adverse production impacts. Section 6 summarizes the status of change in these areas and conveys the attitudes and concerns of the respondents.
2.2.5 Wastewater Treatment/Sludge Management
The Federal electroplating and metal finishing pretreatment wastewater standards were developed by EPA by identifying commonly used treatment practices, and determining their effectiveness by collecting effluent data from well-operated systems. Conventional treatment (a series of unit processes used extensively by industry that have provided reliable treatment for many electroplating operations) was selected by EPA as the standard system. Therefore, for most plating shops, use of conventional treatment will provide sufficient pollutant removal to meet discharge standards. There are two major exceptions to this rule. First, many plating shops are regulated by local discharge standards that are more stringent than the Federal standards and conventional treatment may be insufficient to meet these limitations. Second, the treatment systems selected by EPA for establishing the Federal standards were those systems that EPA determined to be "properly operating facilities." For example, EPA omitted facilities that: (1) did not have well operated treatment processes; (2) had complexing agents (e.g., non-segregated wastes from electroless plating); and (3) had dilution from non-plating wastewaters. As a result, some plating facilities may not meet the properly operated facility criteria used by EPA and may have difficulty meeting Federal standards using conventional treatment.
In cases where conventional treatment is insufficient to meet discharge limitations for a given facility, there are three basic choices for attaining compliance: (1) correct or upgrade the existing processes; (2) make internal changes (e.g., improve rinsing, add recovery, segregation of waste streams) to "normalize" the wastewater, (3) use conventional treatment plus additional treatment (i.e., polishing), and (4) use alternative treatment reagents and/or processes. Information on each of these methods is covered in this text.
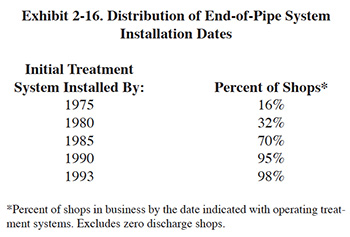
Pretreatment standards for the electroplating industry were first established in 1974, but it was not until promulgation of 40 CFR 413 on September 7, 1979 that Electroplating Categorical Pretreatment Standards became a reality. Several years later, EPA promulgated the Metal Finishing Categorical Standards (40 CFR 433). Prior to the existence of Federal standards, plating shops were regulated locally (if at all), presumably with wide variation in effluent limitations and levels of enforcement. Most plating shops did not have treatment systems for cyanide destruction and metals removal. Approximately 12 percent of the surveyed plating shops that were in business in 1975 (excludes zero discharge shops) indicated that their initial treatment system was installed by that year. Exhibit 2-16 presents a breakdown of the data in five year increments. These data indicate that by 1985, after the compliance dates for Federal regulations, 70 percent of the surveyed plating shops had installed their initial treatment system (excludes zero discharge shops).
Most plating shops installed conventional treatment to meet Federal regulations. Although it is difficult to assess exactly the respondents' data concerning end-of-pipe technology, it appears that an early trend occurred during the late 1970's and early 1980's when a significant percentage of shops attempted to utilize advanced technology in place of conventional treatment. These early efforts generally resulted in failure and the shops later resorted to conventional systems. One prominent example of this trend is the implementation of high surface area electrowinning as an end-of-pipe technology. Between 1979 and 1983, approximately 4 percent of the shops (excludes zero discharge shops) in existence installed this technology at an average cost of $66,360. Only one of these systems is currently operating and that unit was extensively modified by its user. Early failures such as these appear to have had a negative impact on advanced technology. No single technology has since emerged as a significant replacement for conventional treatment. In fact, changes in end-of-pipe methods have tended toward simpler technologies. This conclusion is supported by the fact that the most significant technology change with respect to end-of-pipe treatment since 1975 is the use of sludge dehydration equipment (i.e., sludge dryers) to reduce the volume of sludge shipped off-site (29 percent of the respondents have installed this relatively simple technology with approximately 80% purchased between 1988 and 1993). Approximately 10% of all the shops surveyed presently rely on non-conventional treatment methods (includes zero discharge shops). The most popular non-conventional end-of-pipe treatment methods (ion exchange, evaporation, and membrane technology) are addressed in Section 7.
It should be noted that the majority of respondents to the Users Survey were job shops. More frequent use of advanced end-of-pipe technology may exist in other industry segments such as captive aerospace facilities.
Approximately 8% of the shops surveyed have attained zero discharge (24 shops). These shops are generally smaller and less diverse than the shops with discharges. The maximum, average and median number of employees at the zero discharge shops is 30, 16 and 15, respectively (for all shops responding to the survey, the employee figures are: maximum = 3,000, average = 67 and median = 35). Of the zero discharge shops, 58% are primarily hard chrome platers. The hard chrome process is one of the easiest to operate as a close-loop because of the high ratio of evaporation to drag-out (i.e., permits use of spray rins-ing over the bath, drag-out recovery rinsing, etc.). The remaining zero discharge shops operate various metal finishing processes, including: cadmium, nickel and zinc plating; conversion coating; and aluminum finishing. Details of their metal finishing processes and pollution prevention and control technologies are contained in the NCMS database and summarized in this text.
One of the most frequent concerns of platers is the availability and cost of disposal for treatment process residuals (mainly F006 sludge). Of the respondents that generate F006 sludge, the average and median generation rates are 158,272 lbs/yr and 50,000 lbs/yr, respectively (excludes shops with zero generation rates and PS 273 which generates a large volume of dilute sludge). These shops spend an average of $0.52/lb for sludge disposal (includes, where applicable: transportation, stabilization, disposal or recycle, and taxes) (median cost is $0.25/lb). The unit costs for sludge disposal vary widely, depending mostly on the annual quantity of sludge generated. For example, shops that generate less than 10,000 lbs/yr pay an average rate of $1.58/lb, while shops generating more than 1 million pounds per year pay an average of $0.05/lb.
Discussions of sludge generation rates and costs are presented in Sections 7 and 8. Section 7 provides data from each respondent covering sludge generation rates, the location of their disposal site, the distance that sludges are hauled, the solids concentration of the sludge, and the disposal charges. Many platers (33% of the respondents) are using off-site metals recyclers as an alternative to land disposal of their treatment residuals and spent process solutions. Section 8 identifies the recycling companies used by the respondents, presents an overview of their recovery processes (provided by the recycling companies themselves), presents criteria for determining the applicability of off-site recycling, and compares the costs of recycling to land disposal.
2.2.6 Miscellaneous Survey Data
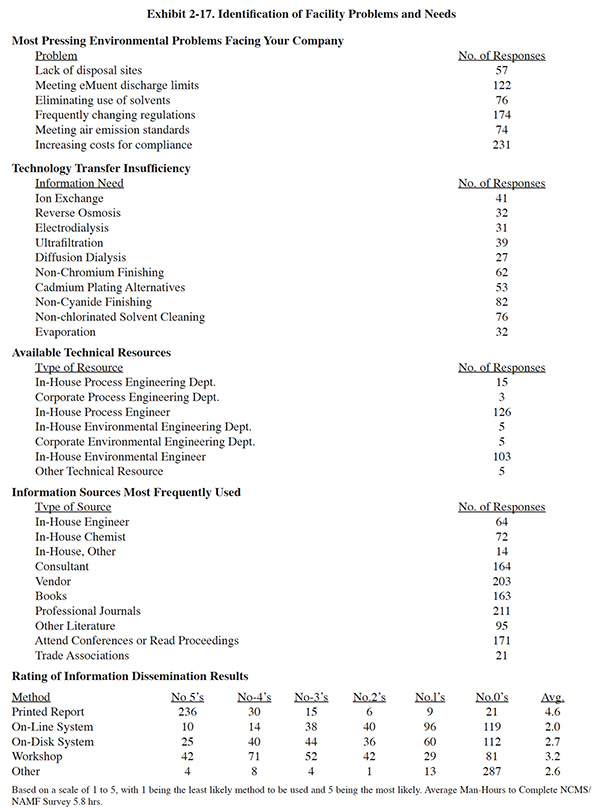
Exhibit 2-17 presents a summary of data that helps to identify the environmental problems and needs of the survey respondents. For each topic shown, the questionnaire listed potential answers that were checked-off by the respondents. The following observations were made from reviewing these data:
- The most pressing environmental problems cited by the respondents were the increasing costs of compliance, frequently changing regulations and meeting effluent discharge standards.
- Areas where the respondents indicated that they need additional technology transfer are more frequently process related (e.g., non-cyanide finishing) than technology related (e.g., electrodialysis).
- The most common types of environmentally related technical resources available to the respondents are an in-house process engineer or an in-house environmental engineer. Due to the fact that most of the respondents were job shops, as opposed to large manufacturing plants, very few of the responding shops had multiple technical personnel available.
- A broad range of technical resources are used by the respondents for obtaining information on pollution prevention. The most common resources are professional journals, vendors, conferences or conference proceedings, books and consultants.
- When asked to rate information dissemination methods for the results of this project that they would potentially use, the respondents rated the printed report the highest.
- The average number of man-hours that the respondents spent gathering data and completing the survey questionnaire was 5.8 hours.
The survey questionnaire also asked platers to list environmental technology needs that are most important to their company. No checklist was present in the survey form for this question and therefore a broader range of responses was received than for similar questions. All of the responses are contained in the database; the following is a list of the needs that at least two or more platers offered (the number of shops that listed each of these needs is shown in parenthesis).
- Alternatives to solvent cleaning/degreasing (37 shops)
- Better cyanide plating alternatives or controls (35 shops)
- Improved methods for water reduction, closed-loop processing, source reduction, recycling or zero discharge (28 shops)
- Better cadmium plating alternatives or controls (24 shops)
- Improved methods or more affordable end-of-pipe treatment (21 shops)
- Alternative to chromium metal finishing (includes all uses such as anodizing, plating and conversion coating) (20 shops)
- Affordable options for F006 sludge recycle or dis-posal (8 shops)
- Alternatives to or recycling technologies for nickel (6 shops)
- Improvements to or alternatives for zinc plating (5 shops)
- Improved methods of bath maintenance (5 shops)
- Chromium recovery technologies (4 shops)
- Cost effective treatment or recovery for zinc (4 shops)
- Better and/or more affordable air emissions con-trol technologies (4 shops)
- Affordable and/or small membrane filtration or chemical recovery systems (3 shops)
- Electroless nickel baths with long life span (2 shops)
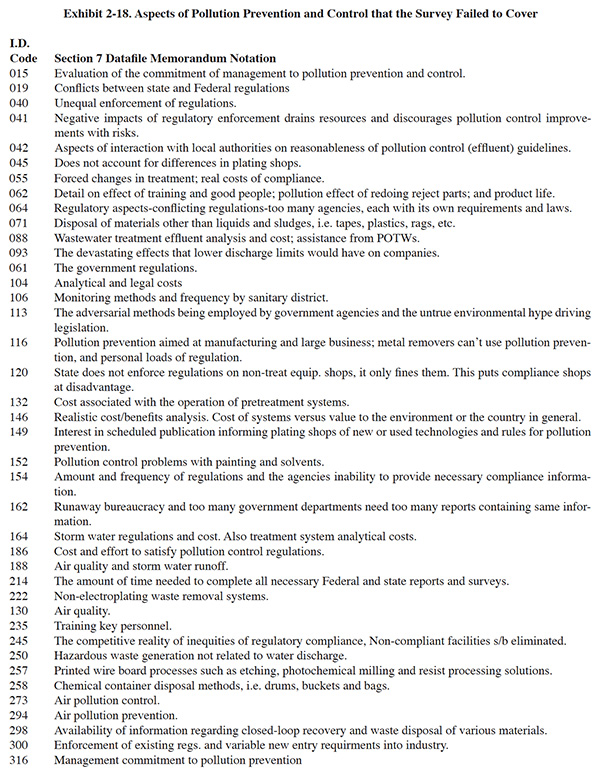
Exhibit 2-18 provides a summary of the responses given by survey respondents when asked to list aspects of pol-lution prevention that the Users Survey failed to cover. Most frequently, their responses were directed at regu-latory and enforcement issues. Others topics listed by respondents that were particularly interesting include: air emissions and controls, stormwater runoff, hazard-ous waste not related to wastewater, printed circuit board operations, painting operations, analytical and legal costs, pollution prevention effects on plating quality, and train-ing requirements. Some of these topics will be included in updated versions of the Users Survey.
2.3 FUTURE SURVEY EFFORTS OF THE NATIONAL CENTER FOR MANUFACTURING SCIENCES
The initial NCMS project activities have established a benchmark assessment of pollution prevention and con-trol technology for plating operations. The project prod-ucts will assist platers in various ways, including: sharing ideas for drag-out and water use reduction; providing useful technology descriptions; providing an explanation of EPA's pollution prevention concept; summarizing cost and performance data from actual technology installations involving chemical recovery, bath maintenance and waste treatment; summarizing platers' experiences with alternative process chemicals that may reduce the hazardousness of the plating processes and the resultant wastes; and providing detailed data for off-site metals recycling options. This assessment has been made possible by the efforts of numerous platers, technology vendors and other interested parties. Hopefully, this industry will continue these efforts by participating in updates of the assessment. Each iteration of the assessment process will refine our technical knowledge and lead to more cost effective means of complying with environmental regulations.
For additional information about this program contact the NCMS Project Manager.2
2 Paul Chalmer: NCMS; 3025 Boardwalk Drive, Ann Arbor, MI: 48108-3266; 313/995-4911.